Data Visualization
We Are Experts in
Tableau

Tableau is a powerful data visualization tool that creates interactive dashboards and reports. It supports multiple data sources, offering drag-and-drop functionality to make data insights accessible and easy to understand.
Microsoft Power BI

Power BI integrates seamlessly with Microsoft products and enables real-time data visualization. It is ideal for creating dynamic dashboards, sharing insights, and enabling collaboration across teams.
QlikView and Qlik Sense

QlikView and Qlik Sense are business intelligence tools known for their associative data models. They provide fast, in-memory data processing and offer advanced analytics with interactive dashboards.
D3.js

D3.js is a JavaScript library for creating custom and dynamic data visualizations. It enables developers to build highly interactive and scalable visual representations tailored to specific business needs.
Google Data Studio

Google Data Studio is a free tool that transforms raw data into customizable and shareable dashboards. It integrates seamlessly with Google services and other data sources for real-time visualization.
Highcharts

Highcharts is a JavaScript-based charting library used for creating visually appealing and interactive charts. It is lightweight, flexible, and suitable for embedding visualizations into websites or applications.
Apache Superset

Apache Superset is an open-source BI platform for exploring and visualizing data at scale. It supports multiple databases and provides an easy-to-use interface for creating insightful dashboards.
Our Recent Projects
Our Data Visualization
Hiring Model
Dedicated Team
A fully committed team focused exclusively on your project. Ideal for long-term collaboration.
Fixed Price Model
Hourly Basis
Flexible model for projects requiring ongoing updates or changes.
Hybrid Model
Combines the best of dedicated and flexible approaches for maximum efficiency.
Technologies we root for


























Contact us for
personalized answers!
01. What are data visualization services, and why are they important?
Data visualization services involve transforming raw data into visual formats like charts, graphs, and dashboards. These visuals make it easier to identify trends, patterns, and insights, enabling better decision-making and communication.
02. What tools do you use for data visualization?
We use leading tools like Tableau, Microsoft Power BI, Google Data Studio, and D3.js. The choice of tools depends on your data complexity, business needs, and integration requirements.
03.Can data visualizations integrate with our existing systems?
Yes, our data visualization solutions integrate seamlessly with your existing databases, CRMs, ERPs, and other tools. We ensure compatibility and real-time updates to enhance your current workflows.
04.What industries can benefit from data visualization services?
Industries like healthcare, finance, retail, logistics, and marketing can significantly benefit from data visualization. It helps businesses track performance, understand customer behavior, and make informed strategic decisions.
Latest news & articles
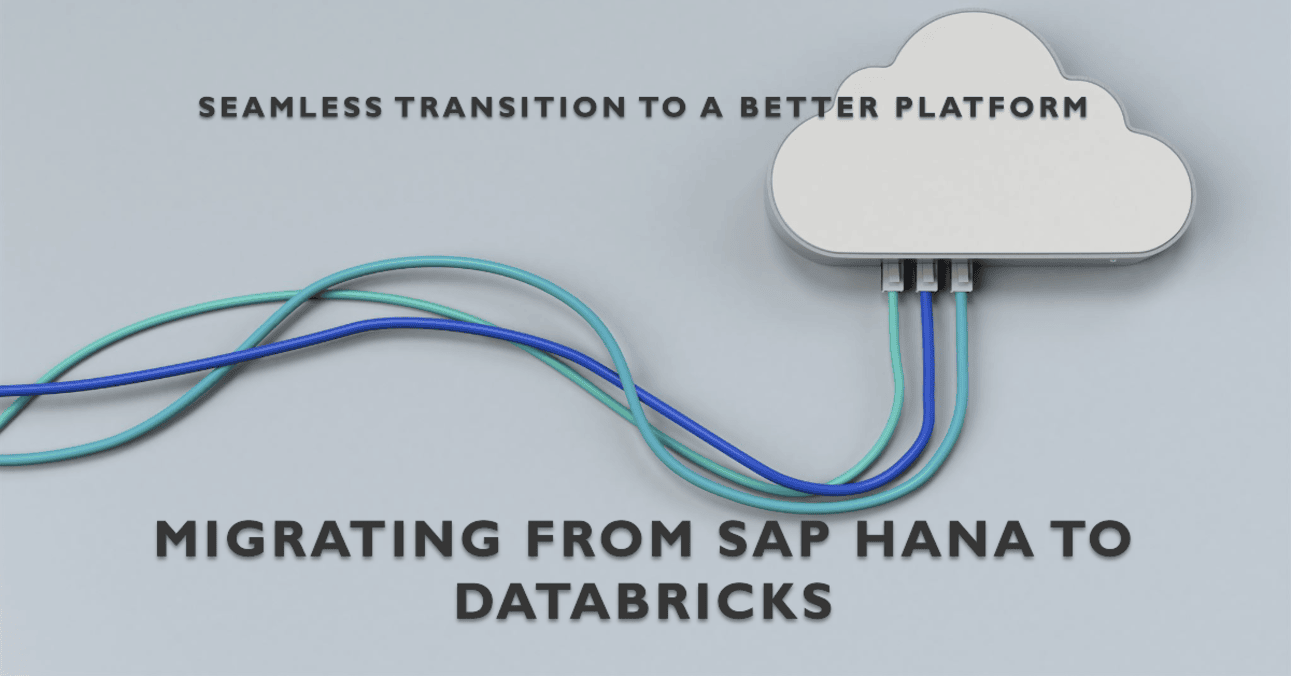
In the rapidly changing world of data, businesses need platforms that not only manage their data but also help them innovate and grow. For years, SAP HANA has been a trusted solution for enterprise data management. However, as demands for real-time insights, scalability, and AI capabilities grow, businesses are finding that platforms like Databricks are better suited to meet their needs.
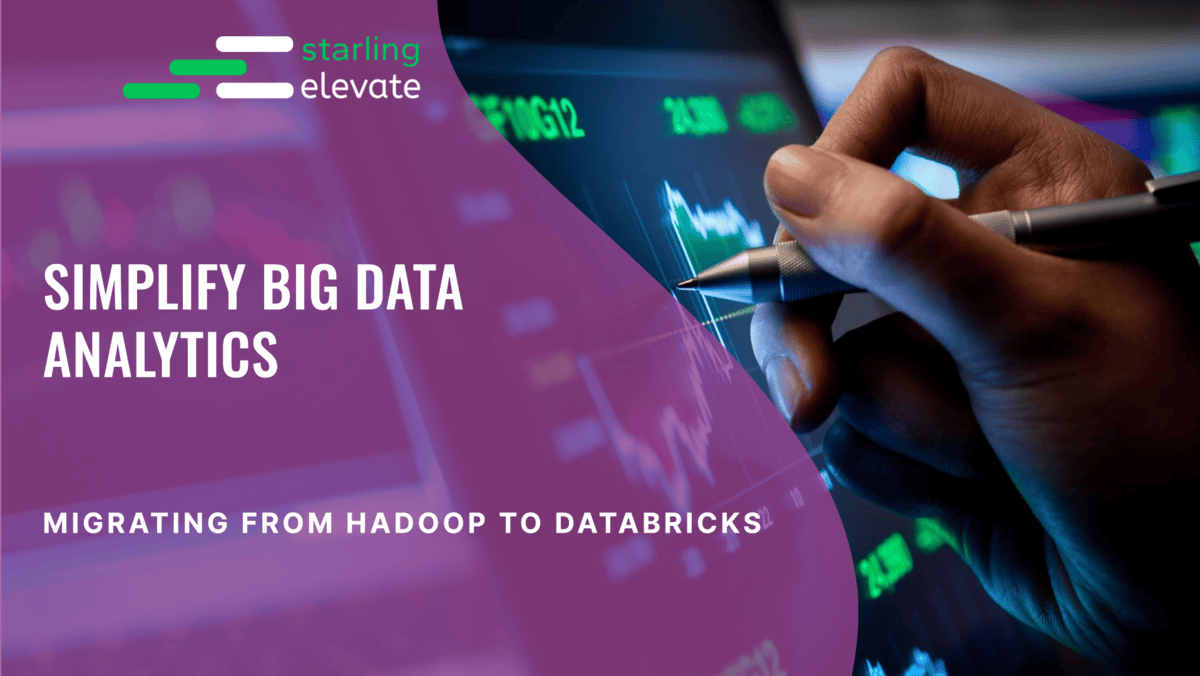
As businesses continue to grow, the tools they rely on must evolve too. For years, Hadoop has been a cornerstone for managing and analyzing big data. However, with the rise of modern analytics and AI demands, Hadoop struggles to keep pace. Enter Databricks, a unified analytics platform that revolutionizes how organizations handle data, offering better speed, scalability, and cost efficiency.
The convergence of big data and artificial intelligence (AI) has revolutionized how businesses operate, driving insights and innovation at an unprecedented scale. At the heart of this transformation lies Databricks, a unified analytics platform, and Generative AI, an emerging field of artificial intelligence. Together, they empower organizations to move beyond traditional analytics, enabling intelligent applications that interpret data and generate actionable outcomes.

